

- Backlinks Explained: Why Your Backlinks Aren’t Paying Off - April 10, 2024
- Boost Your Agency’s Credibility: A Guide to Online Reputation - April 10, 2024
- URL Slugs for SEO: A Comprehensive Guide - April 10, 2024
I have a confession to make. As an SEO team lead, who’s been practicing for 3 years, it’s difficult to admit that I’ve been misinterpreting a metric. Although I don’t believe that any of the strategies I’ve recommended have been off-base or ill advised, I wish I would’ve had the insight I have now. That metric that I’ve misunderstood is bounce rate.
Sure I knew the basics of bounce rate – definition, reasons it can increase, which pages generally have higher rates, etc. But that knowledge was just scratching the surface. I didn’t consider how Google Analytics calculates other supporting data, why the numbers are sometimes skewed, and that a high bounce rate could be a good thing. Yes, a high bounce rate can actually be a great thing!
So where did I go wrong? Why did I miss all of these elements? Well, I guess I wasn’t doing my homework. I think many people – site owners, webmasters, and SEOs alike have been misguided by this metric. Most of the content on the web reaffirms the basics and doesn’t go much beyond. But then you start researching more, conducting your own experiments, and truly embracing the data. That’s when you experience nerd enlightenment. I’ll help you get there too.
Bounce Rate Myths
Alright, let’s start by addressing some of the traps people fall into when learning about bounce rate.
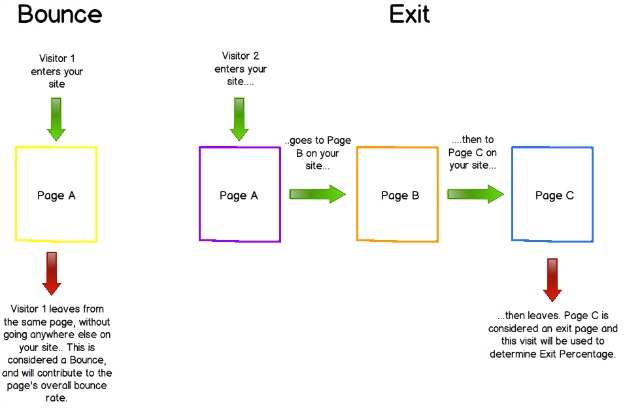
Bounce Rate and Exit Are the Same
This might be basic for most SEOs, however many people do not know the difference between bounce rate and exit percentage.
Bounce Rate calculates the percentage of people that view only 1 page on your site.They enter and exit the site without navigating to any other pages. Therefore, bounce rate is calculated by dividing the total number of visits viewing only one page by the total amount of entries to that page.
Percent exit is defined as the percentage of visitors that leave the site from that page. The visitors could’ve navigated through hundreds of pages before leaving the site. But whatever page they leave on is considered in the percent exit. Exit rate is calculated by dividing the number of exits from the page by the number of visits.
A Bounce Is Only Recorded When A Visitor Clicks Out of The Window
There are multiple ways a visitor can bounce from your site. Although closing the browser tab and/or window is one way, there are a few others:
√ Clicking on a link to a page on a different website
√ Clicking the “Back” button to leave the site
√ Typing a new URL
√ Session Time Out – usually about 30 minutes
√ Going to a sub domain of your site
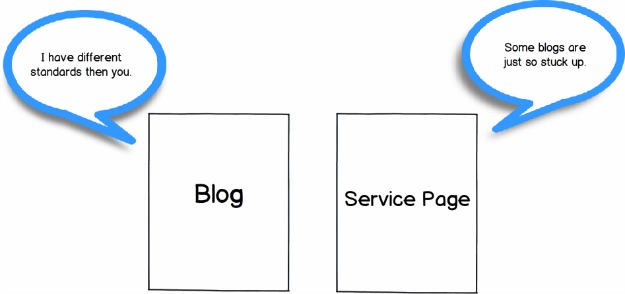
A High Bounce Rate Is Always Bad
Not every page on your site should be treated equally in terms of bounce rate. There are some pages that people will enter on, find what they want, and leave. Blog posts are the perfect examples of pages with high bounce rates. Blog posts are valuable doorways for visitors to find your site. Many blog posts will present data and answer questions – exactly what the visitor is looking for so they head out. But that user had a great experience because they found what they wanted! That’s why you have to consider the goals of each page on your site and evaluate bounce rate with that in mind.
50% Is the Standard Bounce Rate for Sites
This myth is similar to the idea that high bounce rate is always bad. Understanding the goal of each page and the site as a whole will better shape the benchmarks for average bounce rates. Kissmetric’s infographic “Bounce Rate Demystified” outlined the following bounce rates per industry:
√ Retail: 20-40
√ Simple Landing Pages: 70-90%
√ Portals (MSN, Yahoo groups, etc.): 10-30%
√ Service sites (self-service or FAQ sites): 10-30%
√ Content sites: 40-60%
√ Lead generation (services for sale): 30-50%
√ Blogs: 70-98%
Use Average Time on Page with Bounce Rate to See if Visitors Are Getting What They Need
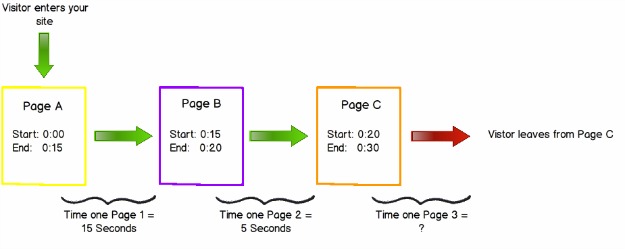
Not many people are aware of how Google calculates time on page. In a nutshell Google Analytics,
“Subtracts the difference between the timestamps for two pages. For example, if a visitor visits Page A at 10:00 a.m. and then Page B at 10:05 a.m., the time on page for Page A will be 5 minutes.” – Google Analytics Support
Therefore, there is no way to calculate the time spent on a page if it’s the only page viewed in a session. So, if I notice that my Main Service page has a bounce rate of 80%, but an average time on page of 2:30, you may be lead to believe that people are finding what they’re looking for and then leaving. However, the average time on page has been calculated when a visitor navigated to other pages in their session. There’s ambiguity whether visitors are actually finding what they’re looking for when they enter and leave without going anywhere else. There could potentially be keyword targeting issues, content issues, or nothing wrong at all. With raw data like this, you just don’t know.
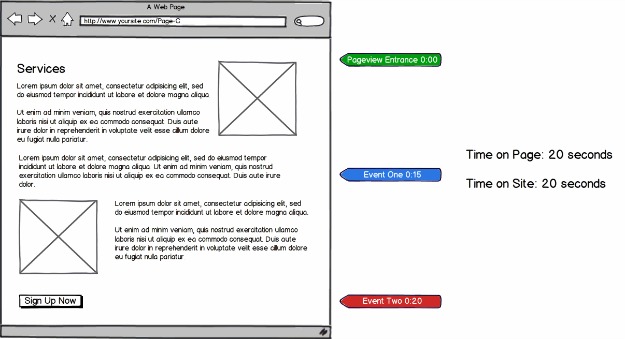
Google Analytics has created an opportunity to avoid ambiguous data with the Adjusted Bounce Rate. Adjusted Bounce Rates uses various page events that you can set up (length of time on page, how far users scroll, etc.) to create time markers on the page. Then, Analytics can use those markers as signals to how long someone is actually spending on a page. More to come on this!
What Data You Should Be Looking At
Now that we’ve cleared up most of the deceiving info surrounding bounce rate, we can talk about the good stuff. What data you should consider, in conjunction with bounce rate, to make the best decisions for your sites or your clients’.
Not Site-wide Bounce Rate
When evaluating bounce rate data, stay away from site-wide averages. As mentioned before, there are many pages on your site with high bounce rates that are effectively communicating with your audience. These pages will skew the overall average and lead you to believe that your site is worse off than it actually is. Start by analyzing individual page bounce rates. Then, you can identify trends, outliers, or other peculiar information that will lead you to investigate further.
Adjusted Bounce Rate
If possible, try to incorporate stats for adjusted bounce rate in your analytics dashboard. Google offers various engagement events that help determine how long visitors are staying when they only view one page. Recordable activities include:
√ How many people scroll
√ When a person starts to scroll
√ When a person reaches the end of an article – not the end of the page
√ When a person reaches the bottom of the page
Traffic Sources
Different traffic sources can refer different types of users – some qualified and some not so qualified. When reviewing bounce rate, keep in mind the following sources:
√ Direct
√ Referrals
√ Search
√ Paid Advertising – PPC and Display
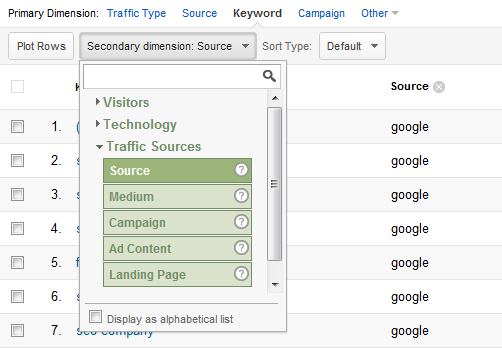
Keywords
Although there is a bunch of data you can use to determine which keywords to target, it’s not an exact science. There are times, although we SEOs would like to think it’s rare, that we target the wrong keywords. Take a look at the bounce rate of the various keywords people are using to find your site. You’d be surprised at the nuances in keywords – plural vs. singular for instance – that affect user intent. Identify keywords that have above average bounce rates for the site and use secondary dimensions to see if there are significant changes based on source, medium, landing page etc.
Devices
Each phone, and there are a lot of them, can render your site differently. Use bounce rate by device to see if your site is having an issue with a certain device. There may even be a particular page that all mobile device users are having issues with. If traffic from this device/to this page is minimal, then I’d just move on. But if you’re receiving a ton of traffic from iPad users and there’s an alarming bounce rate, consider testing your site on the iPad to identify the issue. Or, use a survey tool like Kissmetrics to get further insight into what people are experiencing on this page.
New vs. Returning Visitors
Simply put, new visitors will behave differently than returning visitors. New visitors, unfamiliar with the site might need to navigate around longer in order to find the information they need. Returning users might know the exact page to go to find what they need and leave! Break up the bounce rate data between new vs. returning users and see how their interactions differ.
Medium
Understand the different user behaviors based on where they come from – organic, cpc, and referral. The keywords you target for your organic SEO campaign may different from your paid search campaign and therefore bring different visitors. Find out the spectrum of bounce rate data each channel produces. You might identify that visitors from Google paid search are bouncing more often than visitors from organic search. Use that information to further investigate keywords, landing pages, and other elements that contribute to this metric.
Location
Some sites are highly impacted by the location of their users. If you’re a dry cleaner in Burbank Illinois, you’ll most likely see a high bounce rate from users in Burbank California. If you’re seeing varying bounce rates based on location you might have to evaluate your keyword, content, and local strategy. If you’re showing up for dry cleaners in Burbank California, but you’re located in Illinois, you’ll have evaluate your local factors – maps, addresses, Google places page – to help with your location signals.
You’re Not Done Yet! How to Use the Data
Now that you know what data to look for, I’m sure you’re wondering what to do with it. What do you do for pages with a poor bounce rate? Well, you’ve done the hard part! You’ve identified problem areas. Now you’ll need to perform tests to further understand the cause and remedy a solution.
Refine Keyword Targeting
Keyword targeting is not easy, so don’t worry if you got it wrong the first time. Gather data to see what keywords are doing well and start asking yourself why. Why are these keywords outperforming others? What is the intent of the visitor when they land on this page? What is our goal for the visitor? Is the copy accurately communicating the topics of the page? Are the visitors’ next steps clear? All of these questions are great opportunities to start reevaluating the focus of the page. Get your team, office, clients, friends, and anyone else that can provide effective feedback to help with the cause.
One of the most valuable questions you can ask yourself in this situation is, what are the competitors’ strategies for this keyword? Google the keyword and start investigating the sites on the first page. Then ask the same questions you asked about your own site – what is copy communicating, is it clear what the visitor’s next steps are, etc.
Use AB Testing on Content and Page Layout
One of my greatest passions within SEO is conversion rate optimization. People rarely realize the effect their site’s design can have on the bottom line – leads, sales, branding, etc. Mock up a few different variations of a page and use AB testing/multivariate testing tools to see which page resonates better with visitors. One of my biggest rules of thumb is KEEP IT SIMPLE. Stop shoving as much content as possible on a page and start strategically selecting key communication points. Answer the following questions for users:
√ Am I in the right place?
√ Why is this site/company/brand the best choice for me?
√ What is my next step?
Use Heat Map Tracking Tools
Heat mapping tools, in my opinion, are one of the most valuable yet underutilized resources a site owner can have. These tools create a weather map effect, showing you which areas of a page are clicked on/scrolled through and how often. You’ll begin to see trends in user behavior that will help you make strategic changes. For instance if you see clicks all over the page, without any elements that seem popular, you might have a focus issue on your hands. Too many elements competing for attention with each other, no visual hierarchy, and no clear message. Use the data from these tools to make strategic changes for AB testing.
![]()
Crazy Egg is a fabulous choice for a heat mapping tool.
Use Survey Tools for Feedback
Survey Tools like KissInsights, now Qualaroo, offer site owners and SEOs an opportunity to gain further insight to their audience. Not all companies have a large market research budget that would allow for controlled surveys and studies. Visitors are invited to take online surveys which can consist of even just one question. A sample question could look something like this:
√ What were you looking for on this page?
√ Pricing
√ More information on the product
√ Reviews about the product
√ More images of the product
Many people don’t think that visitors fill out these surveys but you’d be surprised how many do. They really don’t affect user experience unless you have them pop up repeatedly throughout their visit.
If you take away one lesson from this blog post please remember that bounce rate shouldn’t be taken? at face value. Segmenting the data is vital to making more accurate assumptions about your site and its user experience. If you want more leads, sales and conversions on your site, bounce rate analysis is absolutely necessary to getting the most bang for your buck.
So tell us how you managed to decrease bounce rate and increase conversions on your site. We’d love to see some case studies.